
Summary
For this study HealthyStuff analyzed the surface layers of 65 vinyl flooring tiles from 5 different national retailers: Ace Hardware, Build.com, Lowes, Lumber Liquidators, and Menards. Samples were acquired in seven different states: Connecticut, Massachusetts, Maine, Michigan, North Carolina, New York and Vermont. Identical samples where purchased for four products in different states. A limited set of samples were also tested from Home Depot. These samples were not included in the sample set for this report because of Home Depot's ongoing implementation of a phthalate phase-out in their flooring products.
These samples do not represent all of the vinyl tiles sold by these retailers. Also, vinyl sheet flooring was not sampled. The products tested include many popular flooring brands including Armstrong, Style Selections, Tranquility, Designer's Image, Achim, Mohawk, Stainmaster and Shaw.
We also surveyed six major home improvement retailers to assess whether they have adopted policies to phase out these chemicals, and what percentage of vinyl flooring they carry contains phthalates. Results of this survey are available here.
Three research methods were used to analyze the tile surface layers: a High Definition X-Ray Florescence (HDXRF) analyzer by XOS Optics, a Fourier Transform Infrared Spectrometer (FTIR) from Thermo Scientific, and Gas Chromatography/Mass Spectrometry (GC/MS). The XRF analyzer was used to screen for common heavy metals, plastic additives and flame retardants. The FTIR was used to study the presence of phthalates and alternative plasticizers in PVC materials. A subset of samples (12) were sent to a US CPSC certified third party lab for GC/MS plasticizer testing. Details are as follows.
Methods: Identifying plasticizers in vinyl floor tiles
1. Surface layer isolation
Flooring tiles were first separated into their component parts. The thin surface vinyl layer was physically peeled from the thicker backing layer. For the purposes of our analysis we define the surface vinyl layer as the layer containing the embedded image (wood grain, slate, etc.).
Once a surface layer was isolated, we sanded both the interior and exterior surfaces with fine grain sandpaper. The internal surface was sanded to remove any residue of the tile backing layer. In most cases the embedded image could not be removed by sanding. The exterior surface was lightly sanded to remove any surface coatings. The final sample was then lightly washed with isopropyl alcohol prior to analysis.
The tile surface layer is very thin, on the order of a few hundred microns, while the backing layer is much thicker, usually several millimeters.
The surface layers were then analyzed by X-ray fluorescence (XRF) and infrared spectroscopy (FTIR).
2. XRF
The high-definition XRF spectrometer is described here. In this study, the prepared surface layer of each tile was folded several times to increase the sample thickness.
3. FTIR
A Thermo Scientific iS5 Fourier Transform Infrared (FTIR) Spectrometer was used. This FTIR instrument has two modes: ATR (attenuated total reflectance) and transmission. Tile surface layers were analyzed first by ATR and then, if a higher signal-to-noise ratio was needed, by transmission as described below.
ATR
ATR allows the researcher to press a solid sample onto the flat surface of a diamond crystal about 1 mm in diameter. Infrared light generated inside the spectrometer bounces through the diamond, slightly penetrating the sample above and gathering information about the chemical bonds in the sample.
Transmission
For transmission mode, the vinyl sample must be in the form of a very thin film (thickness of 100 microns or less). We used a Specac mini film-maker to make films from the isolated tile surface layer.
The film is placed in a special holder and then placed directly in the path of the infrared beam. According to the chemical composition of the sample, specific wavelengths are absorbed from the beam.
Analyzing spectra from ATR or transmission
The infrared spectrum resulting from either ATR or transmission shows peaks corresponding to the chemical bonds present in the sample. Every chemical has a signature set of peaks, allowing researchers to identify what the sample is made of. The experimental spectrum can be compared to spectra from samples of known composition. When a set of characteristic peaks match in the unknown and known spectra, this strongly indicates a match.
Plasicizers such as ortho-phthalates and terephthalates have distinct spectral signatures in FTIR. In this study, we repeatedly identified one or more of three plasticizers or classes of plasticizers in the tile surface layers and thus chose to focus on these three:
-
Ortho-phthalates class of plasticizers, commonly referred to as “phthalates”
-
Dioctyl terephthalate (DOTP)
-
Diethylene/dipropylene glycol dibenzoate esters (abbreviated "dibenzoate esters")
Other non-phthalate plasticizers that we did not analyze for, such as DINCH or ATBC, could be present in some of the tiles.
Ortho-phthalates were treated as a single entity since the individual phthalates are difficult to distinguish (for example, di(ethylhexyl)phthalate versus di(isononyl)phthalate).
Many of the vinyl floor tiles were found to contain more than one plasticizer. The secondary or tertiary plasticizers often gave only weak peaks, likely due to low concentration. We developed a systematic method of inspecting each spectrum so as not to miss weak peaks. The method is briefly described as follows:
Four defined regions of each spectrum were visually examined. Each region contains peaks characteristic of the three different plasticizers (if present). The findings were noted for each region. Then a conclusion was made as to which plasticizers were identified overall.
Figure 1 shows example spectra of two floor tiles. The sample in blue contains all three plasticizers with DOTP dominating. The sample in red contains only dibenzoate esters above the lower detection limit. Several of the peaks we used for identification are labeled on both spectra.
Figure 1: Plasticizer peaks in IR spectra

GC/MS validation of FTIR
Twelve tile surface layers were selected for external lab analysis by gas chromatography/mass spectrometry (GC/MS). GC/MS can distinguish between individual phthalates as well as alternative plasticizers.
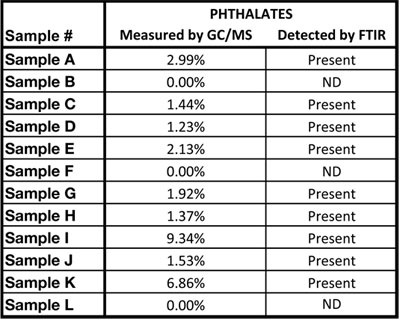
The FTIR visual inspection method described above produced results consistent with GC/MS. The GC/MS results, when compared to our FTIR results, showed that even very weak peaks in the FTIR spectra--centered at the expected energy--were reliable indicators of the corresponding plasticizer. See Table 3.
Table 3: Phthalate Detection by GC/MS Compared to FTIR
Limit of Detection
Based on comparison with GC/MS, the lower limit of detection for the FTIR method in this study is roughly 1% by mass for each plasticizer. This is a conservative estimate, as lower concentrations may be detectable in some samples.